Investigations of the African Mantle
The African-Arabian Rift System (AARS) has been the focus of numerous studies, but it has long been questioned whether low-velocity anomalies in the upper mantle beneath eastern Africa and western Arabia are connected, forming one large anomaly, and if any parts of this anomalous upper mantle structure extend into the lower mantle beneath southern Africa. To investigate the structure of the African mantle further, an adaptively parameterized tomography approach has been employed to generate new P-wave images of this region.
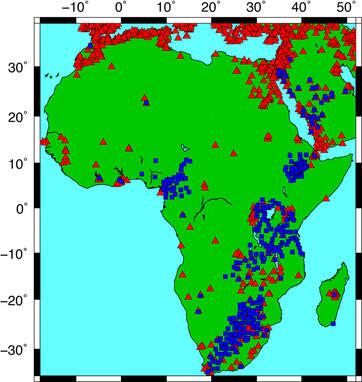
Figure 1. Distribution of seismic stations used in the Hansen et al. (2012) study. Red triangles denote stations included in the ISC global database while blue squares denote stations from augmented networks.
|
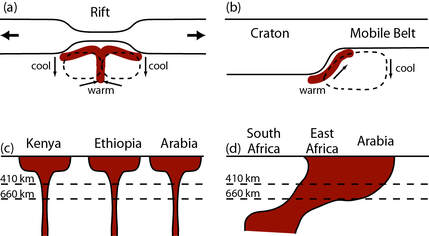
Figure 2. Cartoons illustrating different origin models for the AARS, including (a) small-scale convection induced by lithospheric stretching, (b) small-scale convection resulting from edge-flow, (c) plume models, and (d) the superplume model. |
Data for the tomography model is obtained both from the global International Seismological Centre (ISC) database as well as from both permanent and temporary seismic deployments throughout Africa and Arabia (Fig. 1). Travel-time residuals, in relation to the AK135 Earth model (Kennett et al., 1995), are inverted using the adaptive parameterization scheme described by Li et al. (2008) and Karason (2002). Our goal is to use these tomographic images to assess different origin models that have been proposed for the AARS (Fig. 2).
|
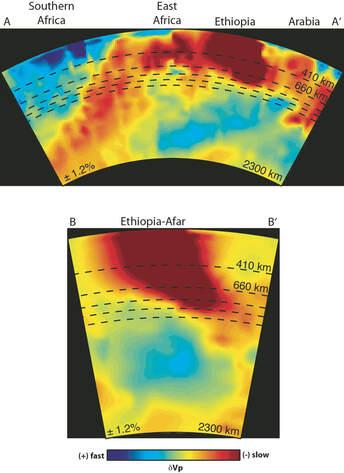
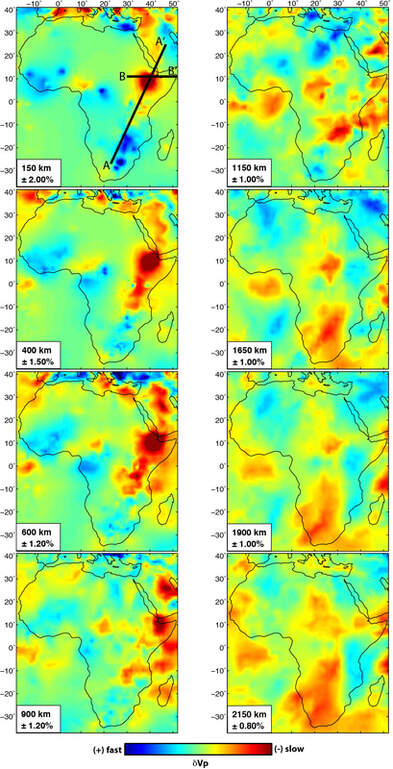
Figure 3. (left) Map-view images through the P-wave tomography model of Hansen et al. (2012), shown at selected mantle depths. The +/- values in each inset indicate the bounds of the color scale used for the corresponding panel. The locations of profiles A-A' and B-B' are shown in the 150 km depth panel. (above) Cross-sectional images along profiles A-A' and B-B'. Dashed lines mark the 410 and 660 km discontinuities as well as depths of 800, 900, and 1000 km. |
Our model illustrates that low velocities are prevalent beneath all of eastern Africa and western Arabia, with a very pronounced anomaly situated beneath Ethiopia and Afar (Fig. 3). Additionally, we observe a large, low-velocity anomaly at deep mantle depths beneath southern Africa that extends to the northeast as it approaches the surface. Our findings are most consistent with the model shown in Figure 2d, which attributes the origin of the AARS and the perturbed upper mantle to the African superplume, a large, thermo-chemical anomaly that develops near the core-mantle boundary beneath southern Africa and tilts northeastward beneath eastern Africa at mid-mantle depths. To explore this potential connection between the AARs and the superplume further, we performed a series of resolution tests using synthetic anomalies in both the upper and lower mantle (Fig. 4). In order to mimic the continuous low-velocity structure seen in our model (Fig. 3), the superplume anomaly must extend upwards to depths of at least ~1100 km, shallower than the ~1500 km depth reported in other studies (e.g., Ritsema et al., 1998; Montelli et al., 2006; Simmons et al., 2010). This strongly indicates a connection between the superplume and the AARS. For more details, please see Hansen_etal_EPSL_2012.pdf.
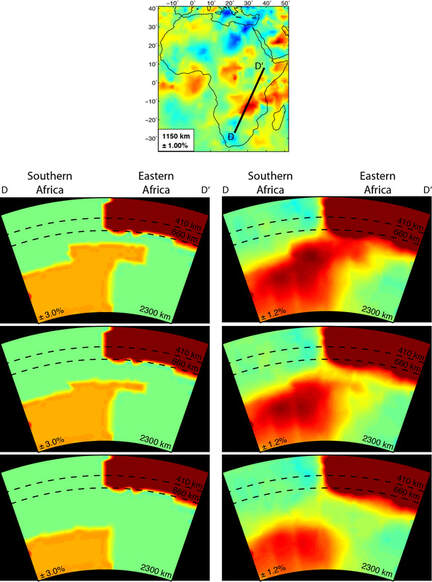
Figure 4. (top) Map showing the location of profile D-D'. (bottom) Cross-sections along profile D-D', with input synthetic models on the left and recovered models on the right. The upper and lower mantle structures were progressively separated to examine their potential connectivity. The top of the lower mantle anomaly is at 900, 1100, and 1500 km depth in the upper, middle, and lower panels, respectively.
To further examine the pronounced anomaly situated beneath Ethiopia and Afar, a second study was undertaken, using the same methodology but with an expanded dataset (Fig. 5; Hansen and Nyblade, 2013). Specifically, it was questioned whether along-strike differences in the seismic structure beneath eastern Africa and Arabia are consistent with the superplume interpretation discussed above.
Figure 5. Map of study area with 30 s digital topography (Wessel and Smith, 1998). Red triangles denote ISC catalog stations, blue squares denote augmented stations used by Hansen et al. (2012; above), and purple squares denote augmented stations new to this study. Bold dashed lines indicate the boundaries of the Main Ethiopia Rift. NMER/CMER/SMER: northern/central/southern Main Ethiopian Rift.
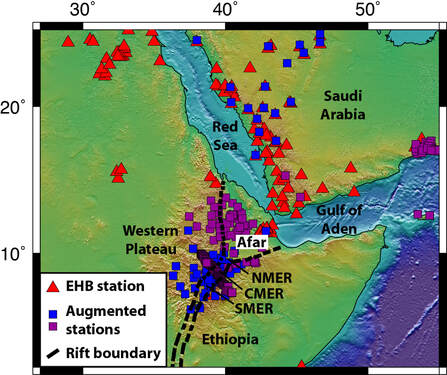
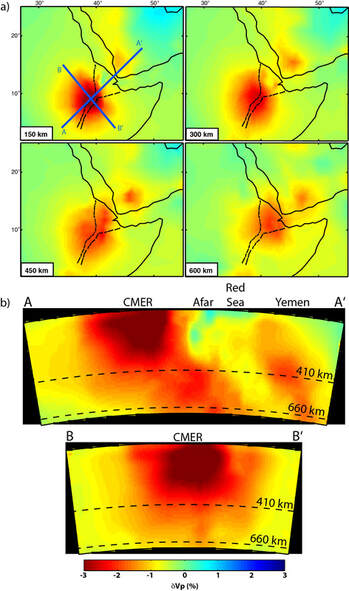
Figure 6. (a) P-wave velocity perturbations at selected mantle depths. Bold dashed lines are the same as in Figure 5. Two profiles, A-A' and B-B', are shown on the 150 km depth panel. Profile A-A' passes through the center of the low-velocity anomaly. Profile B-B' is perpendicular to profile A-A' and runs through the center of the slowest part of the anomaly. (b) Cross-sections along profiles A-A' and B-B'. Dashed lines denote the 410 and 660 km discontinuities.
|
|
At shallow (< ~400 km) depths, the slowest velocities are centered beneath the Main Ethiopian Rift, and we attribute these low velocities to decompression melting beneath young, thin lithosphere. At deeper depths, the low velocity structure trends to the northeast, and the locus of the low velocity anomaly is found beneath Afar. The northeast-trending structure with depth is best modeled by northeastward flow of warm superplume material beneath eastern Africa. The combined effects of shallow decompression melting and northeastward flow of superplume material can explain why upper mantle velocities beneath Ethiopia and Afar are significantly lower than those beneath neighboring East Africa and western Arabia (Fig. 7). For more details, please see Hansen_Nyblade_GJI_2013.pdf.
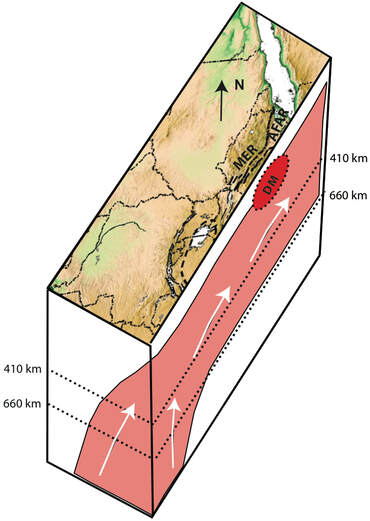
Figure 7. Cartoon illustrating our interpretation of the mantle structure beneath eastern Africa. Pink shaded region and white arrows indicate the flow of superplume material. DM: decompression melting, MER: Main Ethiopian Rift.
A significant amount of new data from Africa has become available since these studies were conducted. Therefore, we are in the process of updating the P-wave tomography model using the adaptively parameterized approach. Additionally, we are also working to develop a corresponding S-wave model. Stay tuned for further developments!