Slab Structure within the Western Hellenic Subduction Zone
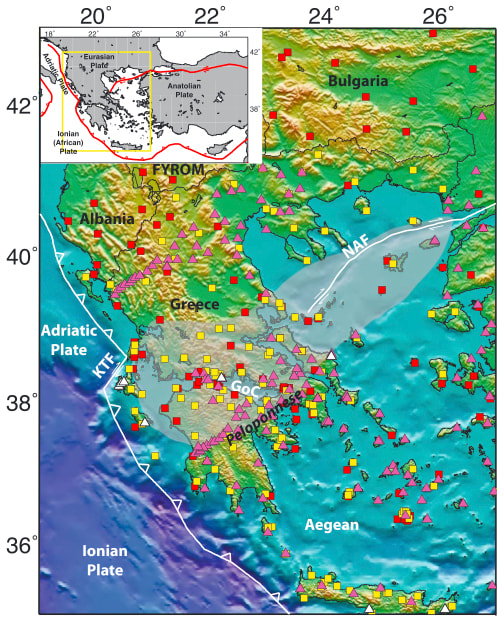
Figure 1. Map of the study area and associated seismic stations. Inset shows the broader Mediterranean area with plate boundaries from Bird (2003) marked in red. Yellow box denotes the study area on the main map. On the main map, white lines mark plate boundaries, and the gray-shaded area denotes the central Hellenic shear zone, as defined by Royden and Papanikolaou (2011). Red squares denote stations that are part of the global ISC catalog only. Yellow squares highlight HUSN stations that are included in the ISC catalog, and additional data have been added for these stations. Triangles denote augmented stations, where white triangles denote HUSN stations and purple triangles denote other deployments. NAF: North Anatolian Fault, KTF: Kefalonia Transform Fault, GoC: Gulf of Corinth, FYROM: Former Yugoslav Republic of Macedonia.
While the Western Hellenic Subduction Zone (WHSZ) has been the focus of numerous seismic studies, the structure between ~150-250 km depth remains poorly resolved. Many questions exist regarding the slab geometry at these intermediate depths, including whether the slab displays any tears related to tectonic processes. We have employed an adaptively parameterized tomography approach to develop a new P-wave model for the WHSZ that bridges the gap between regional- and global-scale seismic investigations. Data for our model come from the global International Seismological Centre (ISC) catalog as well as from the Hellenic Unified Seismic Network (HUSN) and from temporary seismic deployments throughout Greece (Fig. 1).
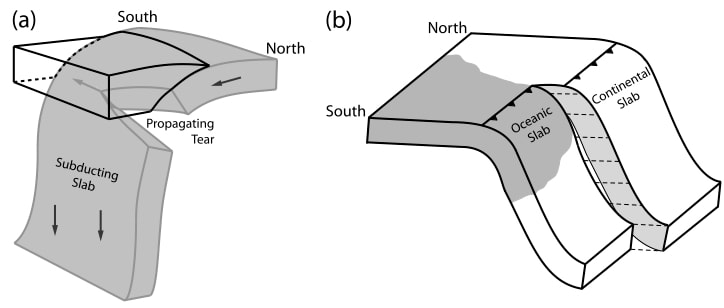
Figure 2. Cartoons illustrating possible slab structure. (a) Proposed horizontal tear in the subducting lithosphere, propagating from north to south. Modified from Wortel and Spakman (2000). (b) Possible structure between the northern, continental and southern, oceanic segments of the subducting slab. The area marked with dashed lines may be torn or warped into a ramp-like structure. Modified from Pearce et al. (2012).
Some studies have suggested a trench-parallel tear, propagating from north to south, in the subducting slab (Fig. 2a; Hosa, 2008; Koulakov et al., 2009; Pearce et al., 2012; Spakman et al., 1993; Zhu et al., 2015). The depth at which this tear may occurs varies between ~150-500 km, depending on the model, and there are also discrepancies over the southernmost extent of the tear. Other studies instead suggest a trench-perpendicular tear, marking the boundary between subducting continental material below northern Greece and subducting oceanic material beneath southern Greece (Fig. 2b; Govers and Wortel, 2005; Royden and Papanikolaou, 2011; Suckale et al., 2009). Ultimately, the geometry of the slab requires further constraint.
Some studies have suggested a trench-parallel tear, propagating from north to south, in the subducting slab (Fig. 2a; Hosa, 2008; Koulakov et al., 2009; Pearce et al., 2012; Spakman et al., 1993; Zhu et al., 2015). The depth at which this tear may occurs varies between ~150-500 km, depending on the model, and there are also discrepancies over the southernmost extent of the tear. Other studies instead suggest a trench-perpendicular tear, marking the boundary between subducting continental material below northern Greece and subducting oceanic material beneath southern Greece (Fig. 2b; Govers and Wortel, 2005; Royden and Papanikolaou, 2011; Suckale et al., 2009). Ultimately, the geometry of the slab requires further constraint.
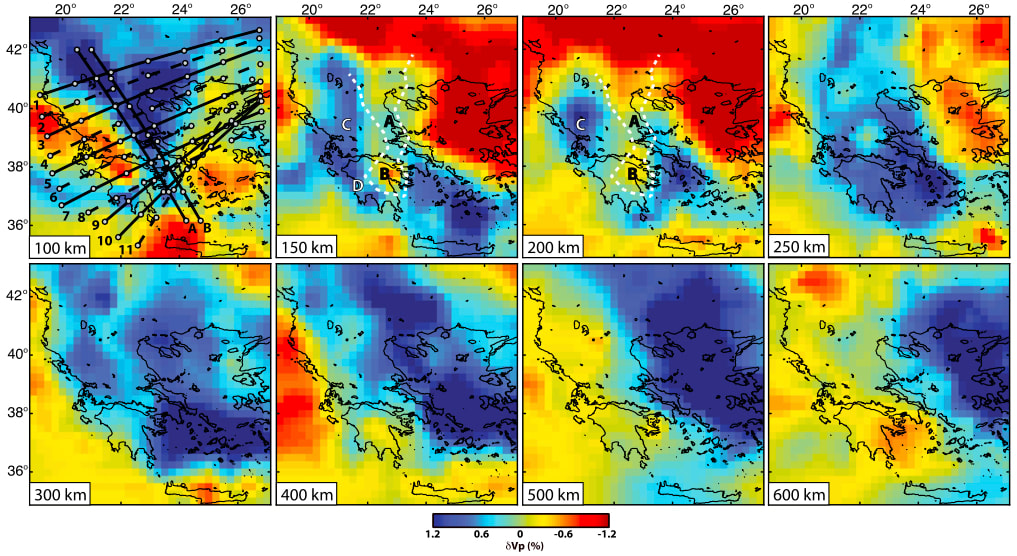
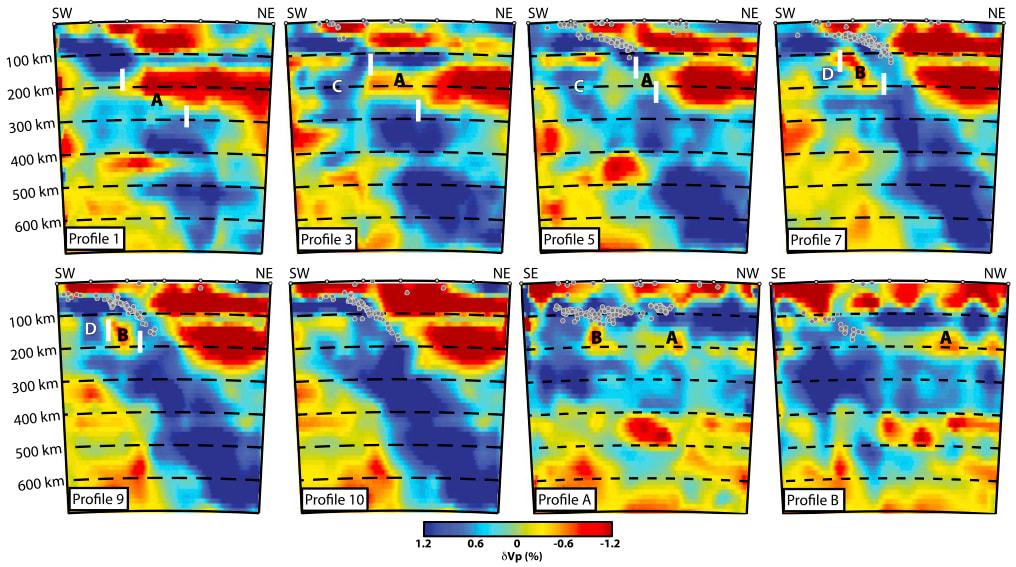
Figure 3. (top) Map-view images at selected mantle depths through the new P-wave velocity model. Locations of cross-sections are shown on the 100-km panel, with profiles marked by solid lines shown in the bottom image. Additional profiles can be found in the supplemental material of Hansen et al. (2019). Trench-perpendicular profiles are sequentially numbered from north to south, and trench-parallel profiles are lettered from west to east. The dashed white lines on the 150- and 200-km panels show the 2-D projection of the interpreted slab tear and low-velocity "hole" (Features A and B). Features C and D correspond to fast velocities in northwestern-central Greece and along the western coast of Peloponnese. (bottom) Cross-sections through the P-wave model. White tick marks on Profiles 1-9 indicate the western and eastern edges of the slab tear and low-velocity "hole" (Features A and B). Features C and D are the same as the top image. Gray dots show earthquake relocations from Halpaap et al. (2018).
Our new tomographic model (Fig. 3) shows a fast anomaly dipping to the northeast, which is interpreted as the subducting slab. However, this structure is discontinuous beneath much of Greece (north of ~38.5 N), and the gap (Feature A) is best interpreted as a trench-parallel tear. Near the Gulf of Corinth, the dipping slab interface becomes continuous, but a low-velocity "hole" (Feature B) is also observed beneath Peloponnese. Feature B is interpreted as marking the southernmost extent of the trench-parallel tear, where the lithosphere has become disrupted but has not completely detached. A summary of our interpreted structure is provided in Figure 4.
Our new tomographic model (Fig. 3) shows a fast anomaly dipping to the northeast, which is interpreted as the subducting slab. However, this structure is discontinuous beneath much of Greece (north of ~38.5 N), and the gap (Feature A) is best interpreted as a trench-parallel tear. Near the Gulf of Corinth, the dipping slab interface becomes continuous, but a low-velocity "hole" (Feature B) is also observed beneath Peloponnese. Feature B is interpreted as marking the southernmost extent of the trench-parallel tear, where the lithosphere has become disrupted but has not completely detached. A summary of our interpreted structure is provided in Figure 4.
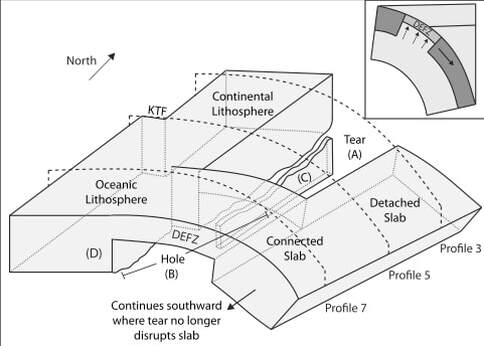
Figure 4. (inset) Stretching model for lithospheric detachment, modified from van de Zedde and Wortel (2001). The subducting lithosphere is thinned over a deformation zone (DEFZ), allowing hot mantle material to fill the gap and eventually leading to slab break-off. (main) Cartoon illustrating our interpreted slab structure (down to ~250-300 km depth; note: not drawn to scale). Black dashed arcs mark the approximate locations of representative profiles from Figure 3 (bottom). Features (A)-(D) also correspond to those labeled in Figure 3. KTF: Kefalonia Transform Fault.
Our interpreted slab structure also agrees well with local seismicity and anisotropy (mantle flow) patterns (Fig. 5). North of the Gulf of Corinth, earthquakes only occur down to ~60-80 km depth, coinciding with the western edge of the tear imaged by our model. We suggest that the detached slab has removed associated slab pull forces, preventing deeper earthquakes. Within and to the south of the Gulf of Corinth, earthquakes extend to greater depths, reaching ~190 km along the eastern coast of Peloponnese. This seismicity pattern agrees well with continuous slab in this area. Further, previous studies (Evangelidis, 2017; Hatzfeld et al., 2001; Schmid et al., 2004) have determined SKS splitting measurements throughout Greece, which are interpreted to reflect the direction of mantle flow. These findings also well-match those from our study. For further details, please see Hansen_etal_G3_2019.pdf.
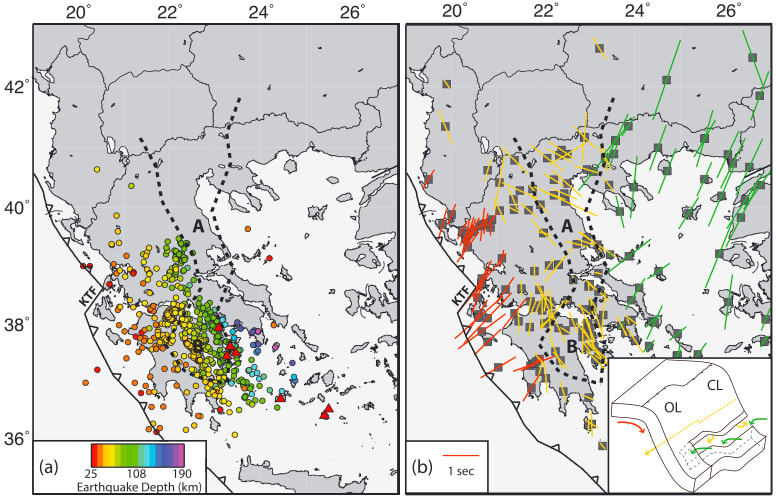
Figure 5. Maps showing (a) earthquake relocations from Halpaap et al. (2018) and (b) SKS splitting measurements from Evangelidis (2017) in relation to the 2-D projection of the interpreted slab tear and low-velocity "hole" (Features A and B) from our tomographic model (black dashed line). In (a), earthquake epcienters (circles) are color-coded by depth. Red triangles denote volcanoes. In (b), SKS splitting measurements at examined stations (gray squares) are oriented in the fast direction and are scaled to the delay time. Yellow markers denote trench-parallel measurements, while red and green markers denote subslab and wedge trench-perpendicular measurements, respectively, as interpreted by Evangelidis (2017). The inset shows a figure modified from Evangelidis (2017), illustrating the suggested mantle flow pattern (arrows), where the colors match those of the corresponding splitting measurements. CL: Continental Lithosphere, OL: Oceanic Lithosphere, KTF: Kefalonia Transform Fault.
This work was funded by a grant from the U.S. Fulbright Foundation.