ULVZ Investigations in the Southern Hemisphere
Ultra-low velocity zones (ULVZs) are laterally-varying structural heterogeneities that have been identified along some portions of the core-mantle boundary. These features have thicknesses on the order of tens of kilometers and are generally associated with reduced seismic wave velocities and increased density; however, ULVZ properties vary amongst different studies (see review by Yu and Garnero, 2018), making determination of the source of these anomalous structures challenging. Only ~17% of the core-mantle boundary has been surveyed for the presence of ULVZs; thus, investigations with new sampling geometries are desired to further constrain ULVZ origins. Using core-reflected waveforms (e.g., ScP, PcP; Fig. 1) recorded by the Antarctic TAMNNET array (see the "Origin of the Transantarctic Mountains" research page), we are expanding ULVZ investigations beneath the southern hemisphere.
Core-reflected ScP Waves
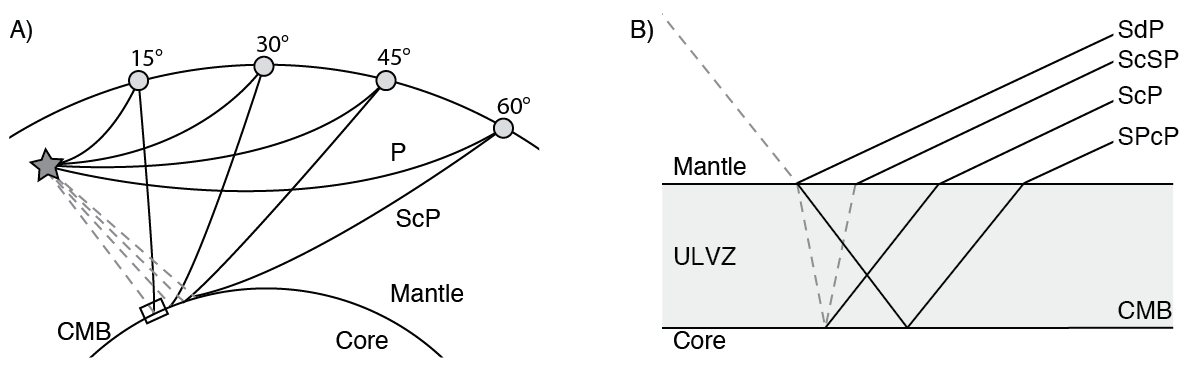
Figure 1. (A) Paths of direct P-waves and core-reflected ScP waves are shown at various distances. The earthquake at 500 km depth is shown as a star, S-waves are shown as dashed gray lines, and P-wave are shown as black lines. The black box highlights the region where ULVZ interaction may occur. (B) ScP pre- and post-cursors resulting from the interaction with a ULVZ. Black and dashed gray lines denote P- and S-waves, respectively. Modified from Brown et al. (2015).
As part of our first TAMNNET study, P- and ScP-waves recorded by TAMNNET were optimally stacked using a cross-correlation and weighting scheme. Also, to compare the waveforms, the P signals were corrected for attenuation. The P-wave stacks were then subtracted from their corresponding ScP stacks to create a remainder trace (Fig. 2). If no pre- or post-cursor energy associated with ULVZ structure is present, the remainder trace will be relatively flat. However, if pre- or post-cursor energy is present, the remainder trace will display residual signal that is present in the ScP stack but not in the P stack (Fig. 2).
As part of our first TAMNNET study, P- and ScP-waves recorded by TAMNNET were optimally stacked using a cross-correlation and weighting scheme. Also, to compare the waveforms, the P signals were corrected for attenuation. The P-wave stacks were then subtracted from their corresponding ScP stacks to create a remainder trace (Fig. 2). If no pre- or post-cursor energy associated with ULVZ structure is present, the remainder trace will be relatively flat. However, if pre- or post-cursor energy is present, the remainder trace will display residual signal that is present in the ScP stack but not in the P stack (Fig. 2).
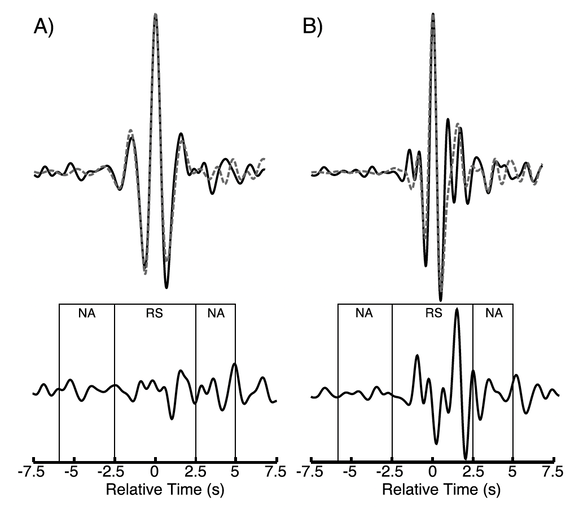
Figure 2. (top) Comparison of attenuated P-wave stacks (dashed gray traces) and ScP stacks (black traces) for two events recorded by TAMNNET. Note that the traces are very similar in (A), indicating no ULVZ energy, while the difference in (B) highlight ULVZ pre- and post-cursors. (bottom) Remainder traces for each event. Again, event (B) shows significant variability, indicative of ULVZ pre- and post-cursor energy. Boxes denote where the remainder trace is windowed to quantify signal and noise, respectively.
The remainder traces were windowed as shown in Figure 2 to quantify their associated signal and noise, and the measurements were divided from one another to define the signal-to-noise (SNR) ratio. The SNR establishes the strength of any ULVZ signal above the noise level. These values were mapped to the event's bounce point on the core-mantle boundary, as shown in Figure 3. As can be seen, numerous events in the vicinity of New Zealand and within the Weddell Sea display significant evidence for ULVZ structure.
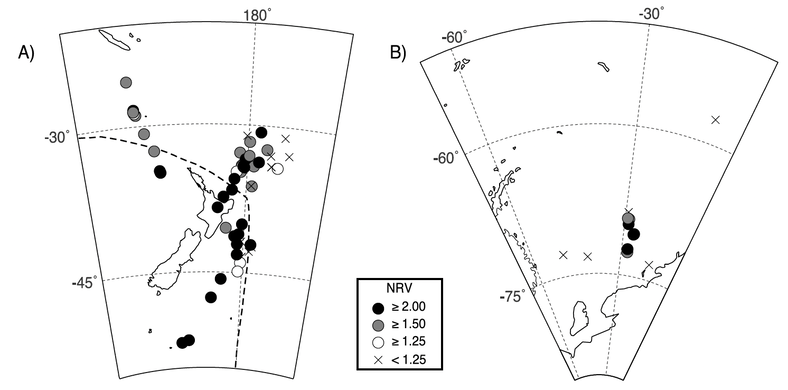
Figure 3. Remainder trace SNR for each event plotted at the ScP bounce point location on the core-mantle boundary. The black dashed line in the left panel highlights the boundary of the Pacific Large Low Velocity Province (LLVP) as identified by the GyPSuM tomography model (Simmons et al., 2010).
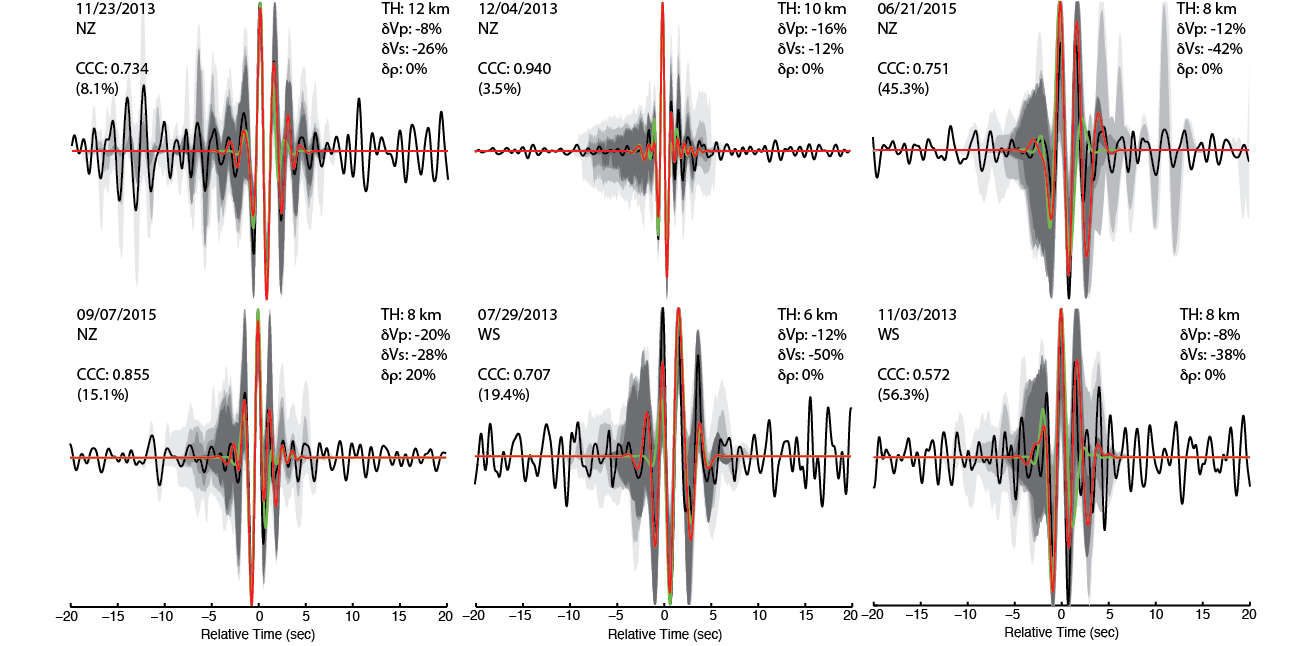
To assess these events further, 1-D modeling was employed to estimate the range of ULVZ parameters (i.e., thickness, P- and S-wave velocity reduction, density increase) that fit our observations. Synthetic waveforms were computed for a range of ULVZ characteristics and were compared to our ScP data, though the events had to meet certain criteria to be eligible for modeling. Only 14 events met all of the enforced criteria. Modeling examples are shown in Figure 4.
Figure 4. Example best-fit synthetic waveforms for modeled events. The observed ScP stack is plotted as a black trace, with its best-fit synthetic shown by a red trace. For comparison, a synthetic seismogram for a model with no ULVZ present is shown by the green trace. Gray shaded areas illustrate increased misfit, with the top 5% best-fit models highlighted in dark gray and the top 10%, 20%, and 40% best-fit models denoted by progressively lighter shades of gray. To the right, the ULVZ parameters associated with the best-fit synthetic model are listed. Cross-correlation coefficient (CCC) values corresponding to the best-fit synthetic model as well as the percent CCC improvement over a model without a ULVZ (in parenthesis) are also provided.
As shown in Figure 3 (left), our results near New Zealand show ULVZs concentrated around the edge of the Pacific LLVP. This is consistent with the idea that ULVZs are chemically distinct structures moved by mantle convection currents toward LLVP boundaries (Fig. 5; Li et al., 2017). For the Weddell Sea data (Fig. 3 right), the sampled portion of the core-mantle boundary is associated with a high velocity, cool region of the lower mantle, far from the LLVP. These findings also support the concept that ULVZs have a compositional origin, as opposed to a solely thermal origin. The Weddell Sea ULVZs may be migrating toward the LLVP.
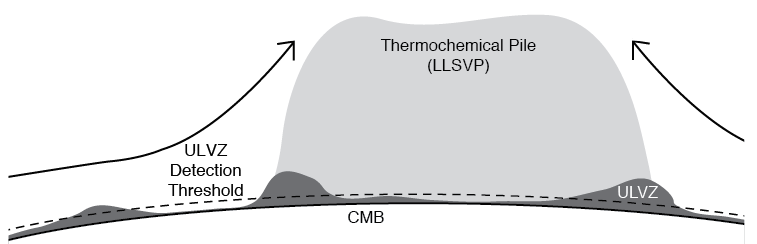
Figure 5. Cartoon illustrating the possible relationship between ULVZs and LLVPs. ULVZs may exist everywhere along the CMB, but they sometimes fall below detection thresholds. Mantle convection currents (black arrows) sweep ULVZ toward the edges of LLVPs.
This work was funded by National Science Foundation grant PLR-1643551.
Core-reflected PcP Waves
We have also modeled core-reflected PcP waves recorded by the TAMNNET array, which provide a broader sampling of the core-mantle boundary beneath the southern hemisphere. Using a recently developed seismic analysis approach (Hansen et al., 2021), robust PcP waveform stacks have been generated and modeled for ULVZ structure (Fig. 6).
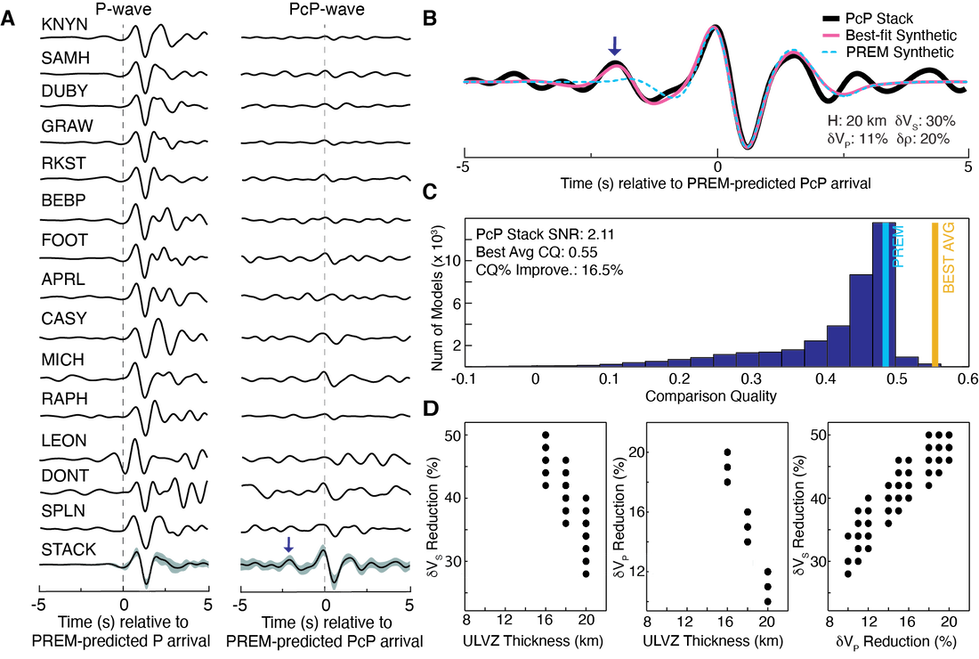
Figure 6. Example PcP waveform stacks and synthetic modeling. In (A) all P traces have been normalized to a maximum amplitude of +/- 1.0 but the PcP traces have been normalized by their corresponding, original P amplitude. The bottom traces show the corresponding stacks, where shading indicates one standard deviation. (B) The PcP stack (black) along with synthetics from PREM (cyan) and from the best-fit model (pink). In both (A) and (B), the small arrow indicates a ULVZ pre-cursor. (C) Histogram showing the range of comparison quality (fit) values from all examined synthetic models. Those associated with PREM and the average CQ (over the top 100 best-fit models) are highlighted by the cyan and orange lines, respectively. (D) Scatter plots showing the range of ULVZ parameters for the top 100 best-fit models.
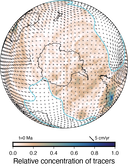
Our results show widespread but variable ULVZ structure across the study area (Fig. 7). Mantle convection simulations were conducted to demonstrate how heterogeneous accumulations of previously subducted materials could form along the core-mantle boundary and explain our seismic observations. Further, the simulations show that subducted materials can be globally distributed throughout the lowermost mantle with variable concentrations (Fig. 8).
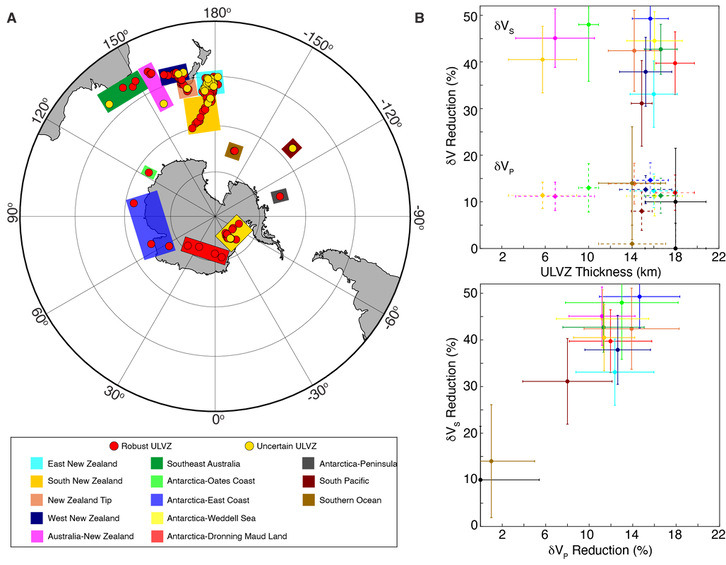
Figure 7. (A) Average PcP core-mantle boundary bounce points for examined events. Red dots indicate events that show robust ULVZ evidence, and yellow dots indicate events that provide possible but uncertain ULVZ evidence. Colored rectangles denote geographic families. (B) ULVZ parameters averaged by geographic family with corresponding standard deviations. Colors are the same as in (A).
|
Figure 8. Distribution of subducted materials along the CMB from geodynamic modeling. The LLVPs are simulated by thermochemical piles, the boundaries of which are marked by the cyan lines. Colors highlight the relative concentration of tracers in the lowermost 50 km of the mantle, where higher (lower) concentrations represent higher (lower) abundances of subducted materials. |
The subducted materials accumulate in the lowermost mantle and are pushed by convection over time to form variable thickness anomalies. The distribution and range of such materials can explain the range of ULVZ properties reported in previous studies. It is possible that the entire core-mantle boundary is coated in ULVZ material (Fig. 9), which would play an important role in how heat escapes from the mantle and how subducted materials may become entrained in upwelling mantle plumes.
More details can be found in the associated Science Advances paper (https://www.science.org/doi/10.1126/sciadv.add4838) and in the corresponding UA press release (https://news.ua.edu/2023/04/beneath-the-earth-ancient-ocean-floor-likely-surrounds-the-core/).
More details can be found in the associated Science Advances paper (https://www.science.org/doi/10.1126/sciadv.add4838) and in the corresponding UA press release (https://news.ua.edu/2023/04/beneath-the-earth-ancient-ocean-floor-likely-surrounds-the-core/).
|
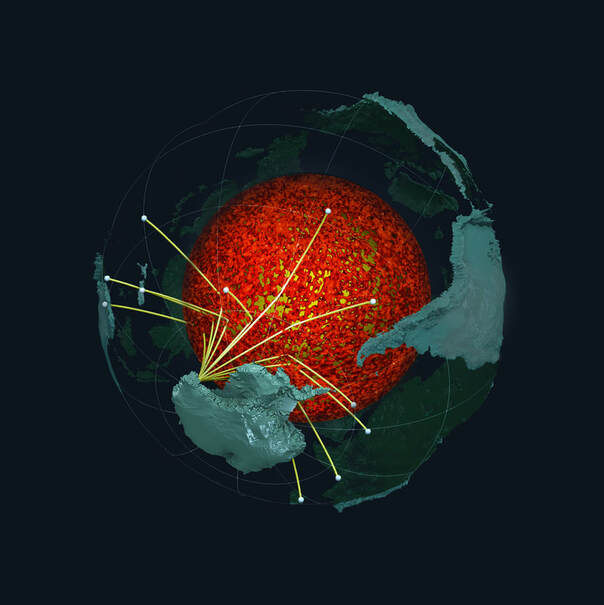
Figure 9. Seismic waves from earthquakes in the southern hemisphere sampling the ULVZ structure along the Earth's core-mantle boundary. Waveforms are recorded by sensors in Antarctica. Image created by E.J. Garnero and M. Li (Arizona State University). Funding for this work was provided by several NSF grants (ANT-1148982, PLR-1643551, EAR-1855624, EAR-2019565, EAR-2216564) as well as an NSF-NERC award (NE/R012199/1). |
|