Origin of the Transantarctic Mountains
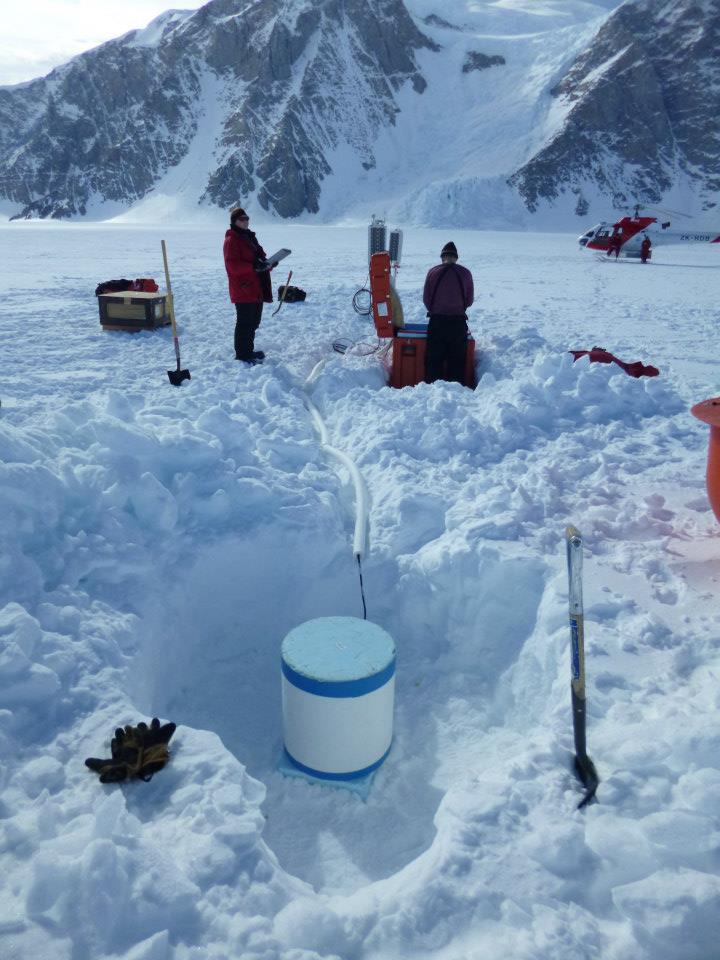
Limited constraints on the crustal and lithospheric structure beneath the Transantarctic Mountains (TAMs) and the Wilkes Subglacial Basin (WSB) have led to uncertainties over competing geologic models that have been suggested to explain their formation. To broaden the investigation of this region, my team and I operated a 15-station array across the northern TAMs and the WSB between 2012-2015, which filled a major gap in seismic coverage. Data from this array, the Transantarctic Mountains Northern Network (TAMNNET), has been combined with that from other previous and ongoing seismic initiatives and has been analyzed with a variety of techniques to generate unprecedented images of the subsurface structure beneath this area. Results from this work have been used to differentiate between competing tectonic models, thereby helping to resolve how the TAMs and WSB originated and how their formation relates to Antarctica’s geologic history. In addition to the findings summarized below, the TAMNNET dataset continues to be incorporated into new investigations of the Earth's southernmost continent.
Crustal Structure beneath the TAMs
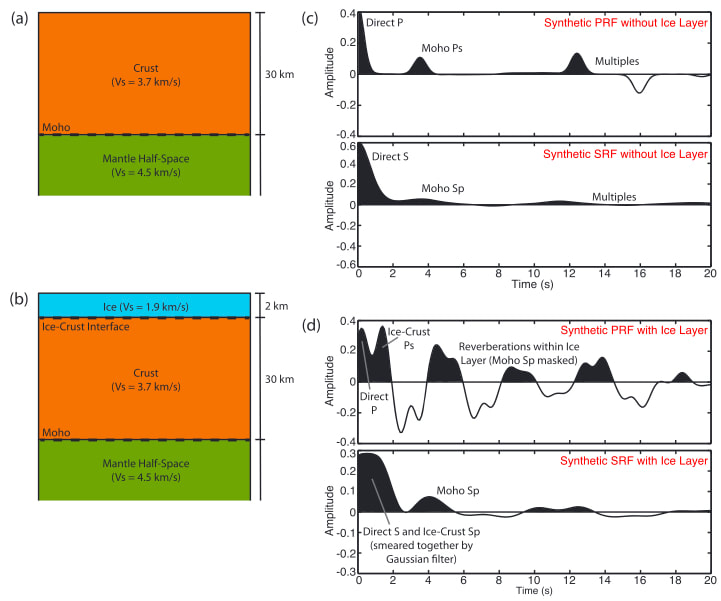
Figure 2. Synthetic receiver function examples. (a) Simple input model with 30 km thick crust overlying a mantle half-space. The shear velocity (Vs) of each layer is indicated. (b) Same as (a) but with a 2 km thick ice layer now included at the surface. (c) Synthetic PRF (top) and SRF (bottom) corresponding to the model shown in (a). The Moho conversion is observed on both, though the amplitude of the Sp conversion is smaller than that of the Ps conversion. (d) Synthetic PRF (top) and SRF (bottom) corresponding to the model shown in (b). The addition of the ice layer causes numerous reverberations, masking the conversions from the Moho on the PRF. However, on the SRF, the Moho conversion is clearly observed.
While P-wave receiver functions (PRFs) are often used to model crustal structure - using Ps conversions from the Moho - reverberations from a surface ice layer can mask the signals of interest. In such cases, SRFs are advantageous (Fig. 2).
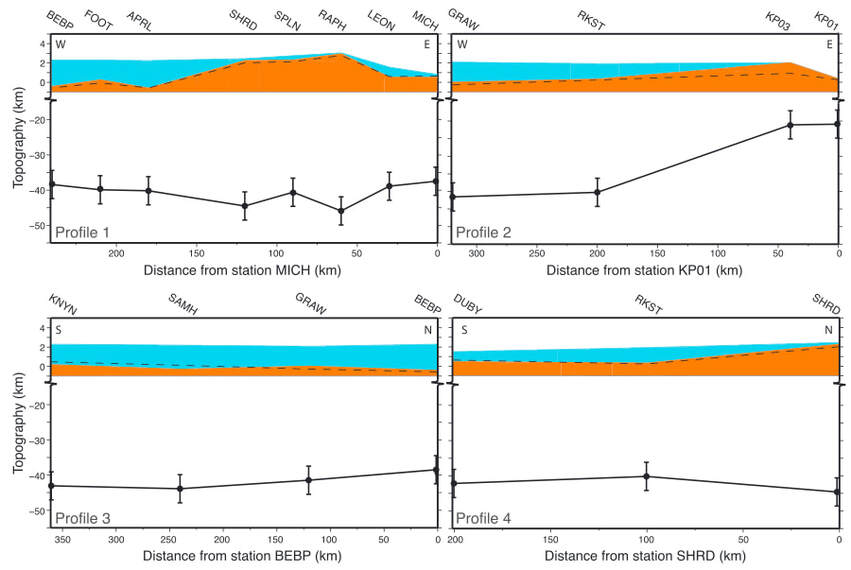
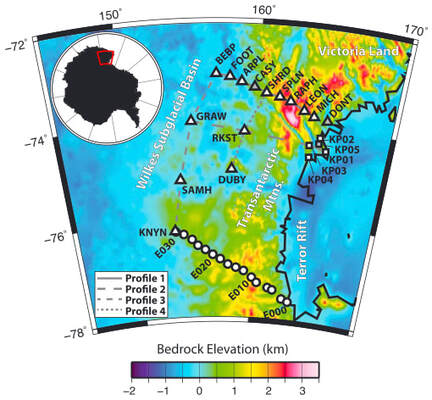
Figure 3. Moho variations along the four profiles highlighted in Figure 1. In all cases, blue shaded areas indicate the ice layer and tan shaded areas indicate bedrock topography. Bedrock elevations were determined by subtracting the ice layer thickness from the corresponding station elevation. Black dashed lines show bedrock topography from BEDMAP2 (Fretwell et al., 2013) for comparison. The Moho depth estimates are plotted as black dots with +/- 4 km error bars. Note the change of scale on the vertical axis of each plot.
Figure 3 summarizes our crustal thickness estimates along each examined profile (Fig. 1). These results are similar to an earlier study (Hansen et al., 2009) conducted in the central TAMs. Generally, the crust increases in thickness from the Ross Sea coastline inland and there is not much evidence for a pronounced crustal root beneath the mountain range. This suggests that crustal isostatic compensation plays little role in supporting the TAMs elevation. For more details, please see Hansen_etal_JGR_2016.pdf.
Surface Wave Tomography
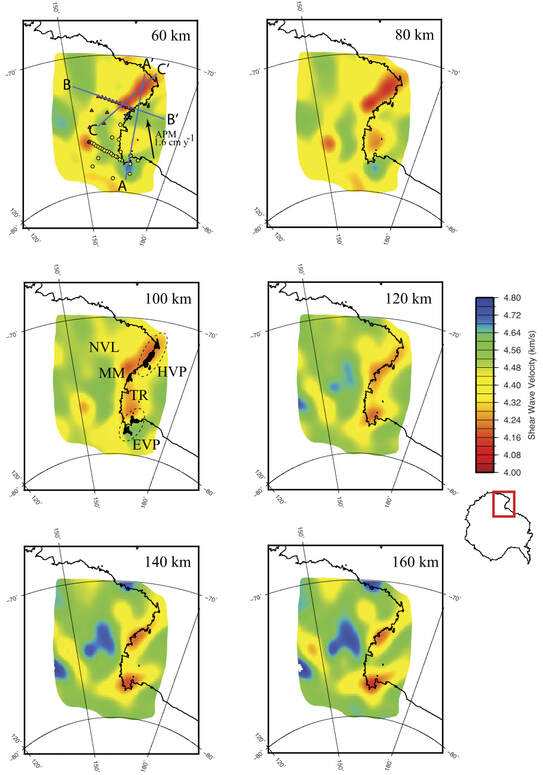
Figure 4. Shear wave velocities at selected mantle depths. On the 60 km depth panel, triangles denote TAMNNET stations, circles denote TAMSEIS stations, inverted triangles denote KOPRI stations, and blue lines denote cross-section locations (Fig. 5). Average plate motion (APM) is shown by the black arrow. Key volcanic areas are indicated on the 100 km depth panel. MM: Mt. Melbourne, HVP: Hallett Volcanic Province, EVP: Erebus Volcanic Province, TR: Terror Rift, NVL: Northern Victoria Land.
Using Rayleigh wave data and a two-plane wave method (Forsyth and Li, 2005), we also generated phase velocity maps beneath the TAMs. The resulting dispersion curves were inverted to model the corresponding shear wave velocity structure in the upper mantle (Figs. 4-5).
Results show a significant low velocity anomaly at ~160 km depth offshore and adjacent to Mt. Melbourne (Fig. 4), which extends inland and vertically upwards, with more lateral coverage above ~100 km depth beneath the TAMs and Victoria Land. A prominent low velocity anomaly is also found at ~150 km depth beneath Ross Island, and relatively slow velocities along the Terror Rift connect the two pronounced anomalies. We interpret these findings as reflecting rift-related decompression melting and suggest that this provides thermally buoyant support for the TAMs uplift, consistent with proposed flexural models (Stern and ten Brink, 1989; ten Brink et al., 1997). Young volcanic rocks associated with various volcanic provinces (Fig. 4) are situated directly above the imaged low velocity anomalies, suggesting that these anomalies are also the source of Cenozoic volcanics. For more details, please see Graw_etal_EPSL_2016.pdf.
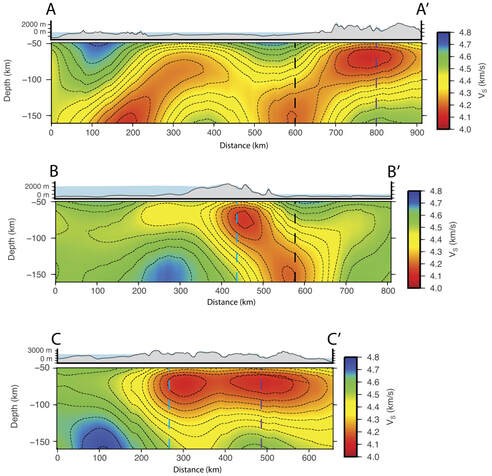
Figure 5. Cross-sections along profiles A-A', B-B', and C-C' (Fig. 4), with bedrock (gray) and ice (blue) topography from BEDMAP2 (Fretwell et al., 2013) shown above. Dashed lines show where the cross-sections intersect one another, matching along the black, blue, and purple dashed lines.
Body Wave Tomography
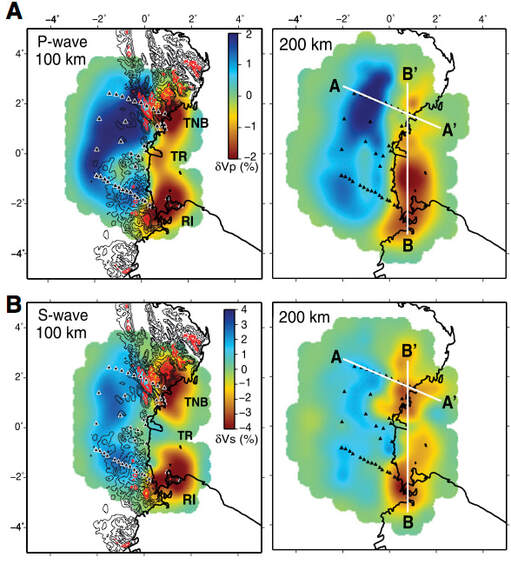
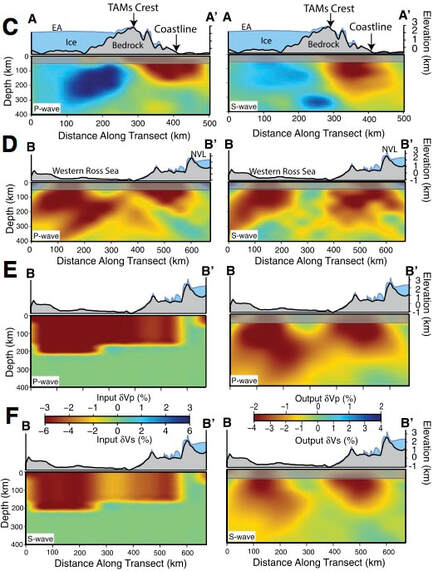
Figure 6. (A, B) Map-view images through our P-wave (A) and S-wave (B) models, highlighting velocity perturbations. Triangles denote stations. On the 100 km depth panels, black topographic contours represent 500, 1000, and 1500 m, and red contours represent 2000, 2500, and 3000 m from BEDMAP2 (Fretwell et al., 2013). Cross-section locations are shown on the 200 km depth panels. TNB: Terra Nova Bay, TR: Terror Rift, RI: Ross Island. (C, D) Cross-sections along (C) profile A-A' and (D) profile B-B'. EA: East Antarctica, NVL: Northern Victoria Land. (E, F) Input and recovery models for P-wave (E) and S-wave (F) synthetic tests.
We also employed body wave travel-time tomography (Zhao et al., 1994) to examine the 3-D velocity structure of the upper mantle beneath the TAMs. This approach provides better lateral resolution compared to the surface wave tomography. Both the P- and S-wave models show fast velocities under East Antarctica, down to ~300 km depth, consistent with a Precambrian craton (Fig. 6). Two pronounced slow velocity anomalies are also imaged adjacent to the TAMs: one beneath Ross Island and the other beneath Terra Nova Bay, both of which extend under the TAMs front. Synthetic tests indicate that these anomalies are best-fit by a continuous, low velocity structure beneath the coast (Fig. 6). We interpret these slow velocities as a thermal anomaly that provides buoyant uplift for the TAMs. This is consistent with flexural uplift models proposed by previous studies (Fig. 7; Stern and ten Brink, 1989; ten Brink et al., 1997). For more details, please see Brenn_etal_Geology_2017.pdf.
We also employed body wave travel-time tomography (Zhao et al., 1994) to examine the 3-D velocity structure of the upper mantle beneath the TAMs. This approach provides better lateral resolution compared to the surface wave tomography. Both the P- and S-wave models show fast velocities under East Antarctica, down to ~300 km depth, consistent with a Precambrian craton (Fig. 6). Two pronounced slow velocity anomalies are also imaged adjacent to the TAMs: one beneath Ross Island and the other beneath Terra Nova Bay, both of which extend under the TAMs front. Synthetic tests indicate that these anomalies are best-fit by a continuous, low velocity structure beneath the coast (Fig. 6). We interpret these slow velocities as a thermal anomaly that provides buoyant uplift for the TAMs. This is consistent with flexural uplift models proposed by previous studies (Fig. 7; Stern and ten Brink, 1989; ten Brink et al., 1997). For more details, please see Brenn_etal_Geology_2017.pdf.
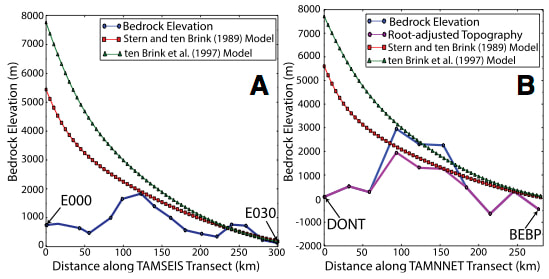
Figure 7. Bedrock topography from BEDMAP2 (blue lines; Fretwell et al., 2013) and modeled flexural profiles along the TAMSEIS (A) and TAMNNET (B) profiles. Red lines show Stern and ten Brink (1989) equivalent model results, and green lines show ten Brink et al. (1997) equivalent model results. Purple line in (B) shows ~1 km adjusted bedrock topography. See Brenn et al. (2017) for further details.
This work has been funded by National Science Foundation grant OPP-1148982.

